 Hire Compass HQ
Phlebotomist Salary: Pay Guide by Experience and State
Median pay, the gap between the lowest and highest earners, and the state and employer differences that decide where your hourly rate lands.
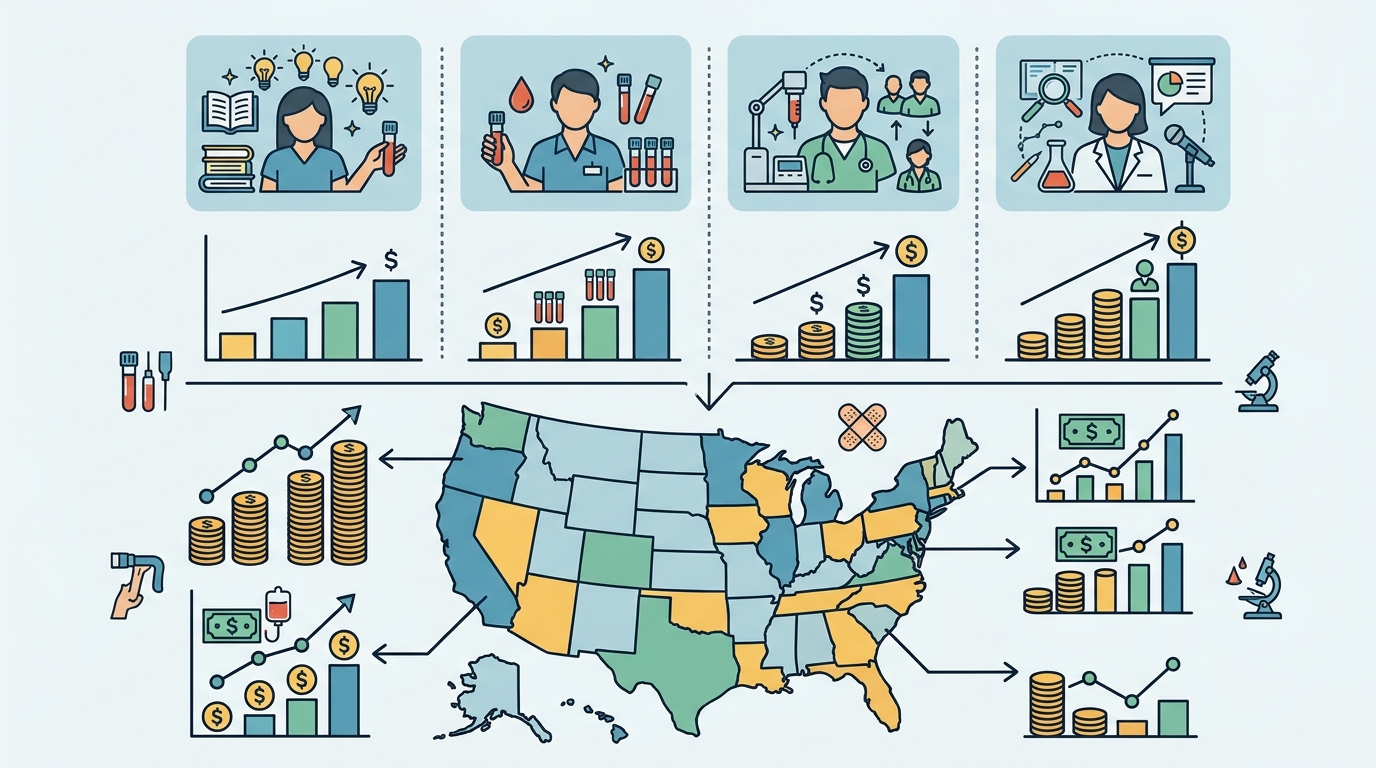
Phlebotomists earned a median wage of $45,230 a year in May 2025 (U.S. Bureau of Labor Statistics, 2025-05), which ONET states as $21.75 an hour for the same year (ONET OnLine, U.S. Department of Labor, 2025). That is higher than the May 2024 median of $43,660 a year, or $20.99 an hour (U.S. Bureau of Labor Statistics, 2024-05), so the occupation's midpoint moved up over the year.
The spread around that median is driven mostly by state and employer type: the bottom 10 percent of Florida phlebotomists earn $35,280 a year or less, while the top 10 percent in New York earn more than $61,930 a year (O*NET OnLine, U.S. Department of Labor).
What This Job Pays Right Now
The median annual wage for phlebotomists was $45,230 in May 2025 (U.S. Bureau of Labor Statistics, 2025-05). Stated as an hourly rate, that same median is $21.75 an hour (O*NET OnLine, U.S. Department of Labor, 2025, whose figures match BLS OEWS).
Pay moved up over the year. In May 2024 the median was $43,660 a year, or $20.99 an hour (U.S. Bureau of Labor Statistics, 2024-05); in May 2025 it was $45,230 a year, or $21.75 an hour (U.S. Bureau of Labor Statistics, 2025-05; O*NET OnLine, U.S. Department of Labor, 2025). Those two pairs of numbers are the comparison to make when an employer tells you a rate is in line with the market.
A median means half of phlebotomists earned more than $45,230 a year and half earned less. BLS also publishes the two outer deciles for May 2025 — the amount the lowest-paid 10 percent earned less than, and the amount the highest-paid 10 percent earned more than (U.S. Bureau of Labor Statistics, 2025-05). Those sit on the BLS page for the occupation and are the first place to look if you want the full national range rather than the midpoint.
For scale, there were 143,900 phlebotomists employed, with growth projected at 7 percent from 2025 to 2035 and about 18,000 openings projected each year on average (ONET OnLine, U.S. Department of Labor, 2025; U.S. Bureau of Labor Statistics, 2025). The largest employing sector is health care and social assistance (ONET OnLine, U.S. Department of Labor, 2025).
Two things drive most of the difference between one phlebotomist's pay and another's: the state you work in and the kind of employer you work for. Both are covered below with the published figures.
Pay by Experience Level
BLS does not publish phlebotomist wages by years of experience. What BLS and O*NET publish are percentile figures — the bottom 10 percent, the average, and the top 10 percent — and those bands are the closest published proxy for a career arc, because new phlebotomists cluster near the bottom decile and long-serving ones near the top. The table below uses published state and national percentile figures as the anchors for each band, with the source named in every cell.
| Experience band | Low | Median / typical | High |
|---|---|---|---|
| Entry-level (0-2 years) | $35,280 a year — Florida bottom 10 percent (O*NET OnLine, U.S. Department of Labor) | $35,710 a year — Pennsylvania bottom 10 percent (O*NET OnLine) | $38,480 a year — New York bottom 10 percent (O*NET OnLine) |
| Mid-career (3-9 years) | $18.54 an hour — Florida average hourly (O*NET OnLine) | $21.75 an hour — national median hourly (O*NET OnLine, U.S. Department of Labor, 2025) | $23.60 an hour — New York average hourly (O*NET OnLine) |
| Senior (10+ years) | $47,160 a year — Florida top 10 percent (O*NET OnLine) | $52,080 a year — Pennsylvania top 10 percent (O*NET OnLine) | $61,930 a year — New York top 10 percent (O*NET OnLine) |
Read across one state to see the arc most clearly. In Pennsylvania the published range runs from $35,710 a year at the bottom decile to $52,080 a year at the top decile (O*NET OnLine, U.S. Department of Labor) — and because both figures describe the same state, that spread reflects experience, shift pattern and employer type rather than location.
The national median of $45,230 a year (U.S. Bureau of Labor Statistics, 2025-05) sits above every entry-level anchor in the table and below every senior anchor, which is what you would expect from a midpoint figure covering 143,900 jobs (O*NET OnLine, U.S. Department of Labor, 2025).
Pay by State or Metro Area
Published state figures are shown below for New York, Pennsylvania and Florida, against the national benchmark. BLS publishes equivalent state and metropolitan-area figures for every other state; check the BLS page for your own state before you judge an offer, because the national median will overstate pay in some states and understate it in others.
| State or area | Bottom 10 percent earn less than | Average hourly wage | Top 10 percent earn more than |
|---|---|---|---|
| New York | $38,480 a year (O*NET OnLine, U.S. Department of Labor) | $23.60 an hour (O*NET OnLine) | $61,930 a year (O*NET OnLine) |
| Pennsylvania | $35,710 a year (O*NET OnLine) | $19.30 an hour (O*NET OnLine) | $52,080 a year (O*NET OnLine) |
| Florida | $35,280 a year (O*NET OnLine) | $18.54 an hour (O*NET OnLine) | $47,160 a year (O*NET OnLine) |
| United States | Bottom-decile figure published by BLS for May 2025 (U.S. Bureau of Labor Statistics, 2025-05) | $20.99 an hour, the U.S. average hourly wage shown alongside the state data (ONET OnLine, U.S. Department of Labor); national median $21.75 an hour (ONET OnLine, 2025) | Top-decile figure published by BLS for May 2025 (U.S. Bureau of Labor Statistics, 2025-05) |
New York is the highest-paying of the three, at an average of $23.60 an hour against the U.S. average hourly wage of $20.99 shown alongside the state data (O*NET OnLine, U.S. Department of Labor). Treat that premium carefully: housing and transport costs in New York City are among the highest in the country, so $23.60 an hour does not buy the same as a similar rate in a cheaper market, and much of the state's top-decile figure of $61,930 a year comes from the downstate metro area rather than upstate.
Florida is the lowest-paying of the three, at an average of $18.54 an hour with a top decile of $47,160 a year (O*NET OnLine, U.S. Department of Labor). Housing costs in parts of Florida have risen sharply while the state has no state income tax, so take-home pay on $18.54 an hour compares better with other states than the gross figure alone suggests — but the gap at the top end is real: $61,930 a year in New York against $47,160 a year in Florida.
If you are weighing a move, compare the same two numbers in both places — the bottom decile and the top decile — rather than the state average, because the average hides how much room there is to grow where you land.
Pay by Employer Type or Industry
BLS publishes a separate May 2025 median annual wage for each of the main industries employing phlebotomists: hospitals (state, local and private), medical and diagnostic laboratories, outpatient care centers, offices of physicians, and all other ambulatory healthcare services (U.S. Bureau of Labor Statistics, 2025-05). The all-employer benchmark to compare each one against is $45,230 a year (U.S. Bureau of Labor Statistics, 2025-05), or $21.75 an hour (O*NET OnLine, U.S. Department of Labor, 2025). Look up the industry rows on the BLS phlebotomist page for the current figure in each category before you choose between offers.
| Employer type | Published pay reference | Why pay sits where it does |
|---|---|---|
| Hospitals (state, local and private) | Industry median published for May 2025 (U.S. Bureau of Labor Statistics, 2025-05); all-employer benchmark $45,230 a year | Hospitals run 24-hour draw schedules, so nights, weekends and on-call coverage add differentials that day-shift settings do not pay. |
| Medical and diagnostic laboratories | Industry median published for May 2025 (U.S. Bureau of Labor Statistics, 2025-05); all-employer benchmark $45,230 a year | High-volume labs pay for speed and sample-handling accuracy, and many staff multiple shifts across a single site. |
| Outpatient care centers | Industry median published for May 2025 (U.S. Bureau of Labor Statistics, 2025-05); all-employer benchmark $45,230 a year | Hours are more predictable and largely daytime, so there is less differential pay baked into the rate. |
| Offices of physicians | Industry median published for May 2025 (U.S. Bureau of Labor Statistics, 2025-05); all-employer benchmark $45,230 a year | Small practices draw fewer patients per day and often combine phlebotomy with front-desk or medical assistant duties. |
| All other ambulatory healthcare services | Industry median published for May 2025 (U.S. Bureau of Labor Statistics, 2025-05); all-employer benchmark $45,230 a year | Mobile and home-draw work sits here; phlebotomists who transport samples may need a driver's license (U.S. Bureau of Labor Statistics, 2025), and travel time changes how hours are counted and paid. |
Health care and social assistance is the top employing sector for the occupation overall (O*NET OnLine, U.S. Department of Labor, 2025). When you compare two offers from different settings, put the two hourly numbers side by side and add the differentials — a hospital rate quoted without nights is not the same job as the same rate with them.
What Actually Moves Your Pay
- Which state you work in. New York's average hourly wage is $23.60 against Florida's $18.54 (ONET OnLine, U.S. Department of Labor) for the same work. At the top decile the comparison is $61,930 a year in New York against $47,160 a year in Florida (ONET OnLine).
- Moving up the percentile range within one state. In Pennsylvania the bottom decile is $35,710 a year and the top decile is $52,080 a year (O*NET OnLine, U.S. Department of Labor) — movement available without relocating, earned through experience, shift pattern and employer type.
- Completing a training program and, where employers want it, certification. Phlebotomists typically enter the occupation with a postsecondary nondegree award from a phlebotomy program that usually takes less than 1 year to complete (U.S. Bureau of Labor Statistics, 2025). That under-12-month step is the gate to the $45,230 median (U.S. Bureau of Labor Statistics, 2025-05); some employers prefer candidates who hold professional certification from a professional organization, with requirements that may include education, clinical experience, an exam and a practical blood-draw component (U.S. Bureau of Labor Statistics, 2025). Basic Life Support certification may also be required (U.S. Bureau of Labor Statistics, 2025).
- State licensing rules. Some states require phlebotomists to complete an accredited training program, hold a license or certification, or meet other requirements (U.S. Bureau of Labor Statistics, 2025). Where those rules apply they shape who can hold the higher-paying posts, which is part of why top deciles differ by state — $61,930 a year in New York against $47,160 a year in Florida (O*NET OnLine). Contact your state licensing agency for the specifics; this guide cannot tell you which rules apply to you.
- The market-wide annual adjustment. The occupation's median was $43,660 a year ($20.99 an hour) in May 2024 (U.S. Bureau of Labor Statistics, 2024-05) and $45,230 a year ($21.75 an hour) in May 2025 (U.S. Bureau of Labor Statistics, 2025-05; O*NET OnLine, 2025). Those two numbers are the baseline to measure any offer or internal increase against.
- Demand in your area. Employment is projected to grow 7 percent from 2025 to 2035, with about 18,000 openings projected each year on average across 143,900 jobs (U.S. Bureau of Labor Statistics, 2025; O*NET OnLine, U.S. Department of Labor, 2025). Steady openings give you room to compare offers rather than accept the first rate quoted.
Frequently asked questions
What does a phlebotomist make per hour?
The national median is $21.75 an hour (O*NET OnLine, U.S. Department of Labor, 2025), the hourly form of the $45,230 median annual wage (U.S. Bureau of Labor Statistics, 2025-05). State averages sit either side of it: $18.54 an hour in Florida and $23.60 an hour in New York (O*NET OnLine, U.S. Department of Labor).
Has phlebotomist pay gone up or down?
Up. The median was $43,660 a year ($20.99 an hour) in May 2024 (U.S. Bureau of Labor Statistics, 2024-05) and $45,230 a year ($21.75 an hour) in May 2025 (U.S. Bureau of Labor Statistics, 2025-05; O*NET OnLine, 2025).
How much can an experienced phlebotomist earn?
The published top-decile figures give the realistic ceiling by state: more than $61,930 a year in New York, more than $52,080 a year in Pennsylvania and more than $47,160 a year in Florida (O*NET OnLine, U.S. Department of Labor). Those top-end figures generally belong to senior phlebotomists in hospital or high-volume laboratory settings with shift coverage.
How long does it take to start earning that pay?
Phlebotomists typically enter with a postsecondary nondegree award from a phlebotomy program that usually takes less than 1 year to complete (U.S. Bureau of Labor Statistics, 2025). Entry pay sits nearer the bottom decile — $35,280 a year or less in Florida, $38,480 a year or less in New York (O*NET OnLine) — rather than at the $45,230 median (U.S. Bureau of Labor Statistics, 2025-05).
Is this a growing field?
Employment is projected to grow 7 percent from 2025 to 2035, with about 18,000 openings each year on average across 143,900 existing jobs (U.S. Bureau of Labor Statistics, 2025; O*NET OnLine, U.S. Department of Labor, 2025). The median wage attached to those jobs is $45,230 a year (U.S. Bureau of Labor Statistics, 2025-05), or $21.75 an hour (O*NET OnLine, 2025).
Sources
- U.S. Bureau of Labor Statistics — Phlebotomists : Occupational Outlook Handbook (2025-05)
- U.S. Bureau of Labor Statistics — Phlebotomists : Occupational Outlook Handbook (2024-05)

Written by
Yuki covers the broader shifts in how people work: shrinking industries, growing ones, the policies that quietly decide who gets steady income. She tends to start stories with a worker's own account before zooming out.